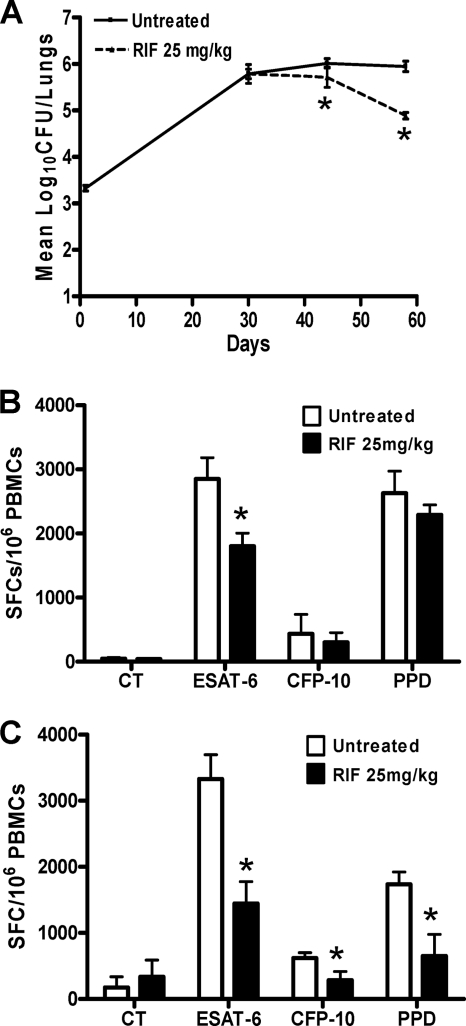
Fig. 6.
Impact of rifampin treatment on T cell response during the chronic phase of infection. Female Wistar rats (n = 4) were infected with 103 CFU of M. tuberculosis strain H37Rv. After 1 month of infection, the rats were orally treated with 25 mg/kg of rifampin for 4 weeks. (A) Bacterial burden was enumerated at day 58 after 2 and 4 weeks of treatment, and mean numbers of CFU and SDs are shown. (B and C) PBMCs were stimulated in duplicate in vitro with ESAT-6, CFP-10, and PPD at 10 μg/ml at 2 weeks (B) and 4 weeks (C) posttreatment. Four animals per time point of each group were used, and the mean numbers of SFCs/106 PBMCs ± SDs are shown. *, P < 0.05 (Student's t test), statistically significant difference between treated and untreated groups. The experiment was carried out twice independently. CT, control (unstimulated) group.

