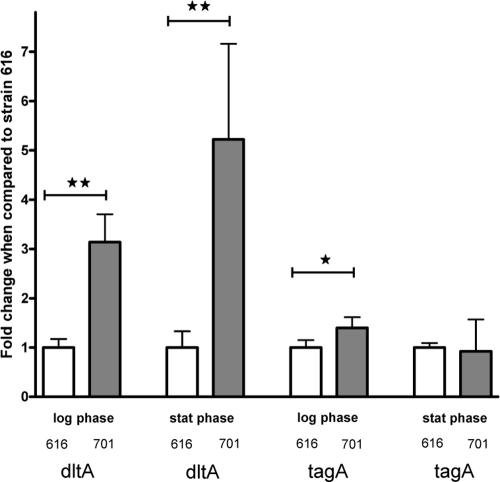
Fig. 5.
Relative transcript levels of the dltA gene and tagA gene in strains 616 and 701. Values from exponential and stationary growth phase RNA samples were normalized versus housekeeping gene, gyrB, expression levels; data from strain 616 were set to 1 to allow comparison of data from different samples. * P < 0.05 and ** P < 0.001 versus 616.

