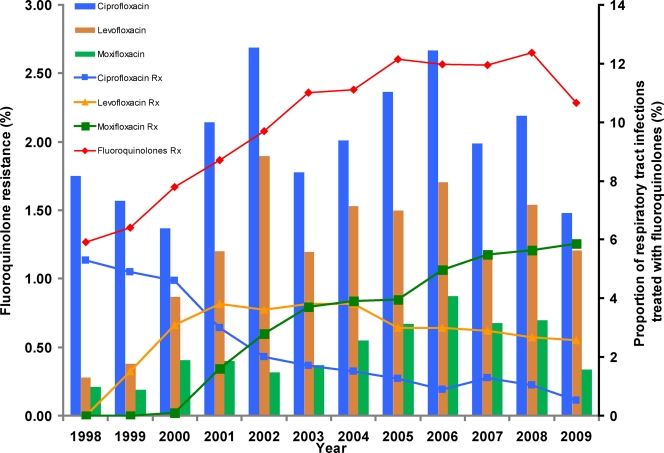
Fig. 1.
Prevalence of fluoroquinolone-resistant isolates (bars) and proportion of fluoroquinolone usage (lines) for the treatment of respiratory tract infections in Canada. The percentages of total fluoroquinolones and individual fluoroquinolones used for treatment of respiratory tract infection are shown. Resistance was defined as a MIC of ≥4 μg/ml for ciprofloxacin and levofloxacin and of ≥2 μg/ml for moxifloxacin. The left y axis depicts prevalence of fluoroquinolone resistance found among pneumococcal isolates collected during the surveillance. The right y axis shows the proportion of respiratory tract infections treated with total fluoroquinolones and individual fluoroquinolones.

