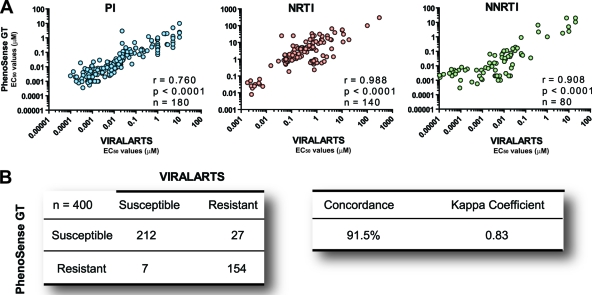
Fig. 5.
Comparing ViralARTS HIV with the current standard HIV-1 phenotypic assay (PhenoSense GT for reverse transcriptase and protease inhibitors). Twenty plasma samples from highly treatment-experienced or treatment-naïve HIV-infected individuals were used to determine drug susceptibility to 20 antiretroviral drugs. Susceptibility to raltegravir was not included in the analysis since the current standard HIV-1 phenotypic assay requires a separate test to evaluate susceptibility to integrase inhibitors (PhenoSense for integrase inhibitors assay). (A) Pearson correlation coefficient was used to determine the strength of association between the EC50s calculated using the two HIV-1 phenotypic assays viruses. r, correlation coefficient; P, two-tailed P value; and n, number of drugs analyzed per drug class. EC50s represent the mean of three independent measurements. (B) Concordance between ViralARTS HIV and PhenoSense GT for reverse transcriptase and protease inhibitor assay. Four hundred drug susceptibility determinations (i.e., 20 viruses times 20 antiretroviral drugs) were used to calculate the concordance between both assays as follows: number of phenotypic determinations with a concordant result (e.g., susceptible-susceptible or resistant-resistant) with both assays, divided by the total number of determinations (i.e., 400), multiplied by 100. The kappa coefficient was determined as described previously (60). Values of kappa can range from −1.0 to 1.0, with −1.0 indicating perfect disagreement below chance, 0.0 indicating agreement equal to chance, and 1.0 indicating perfect agreement above chance. A rule of thumb is that kappa values that are <0.40 indicate poor agreement, ≥0.40 and <0.75 indicate good agreement, and ≥0.75 and <1.0 indicate excellent agreement.

