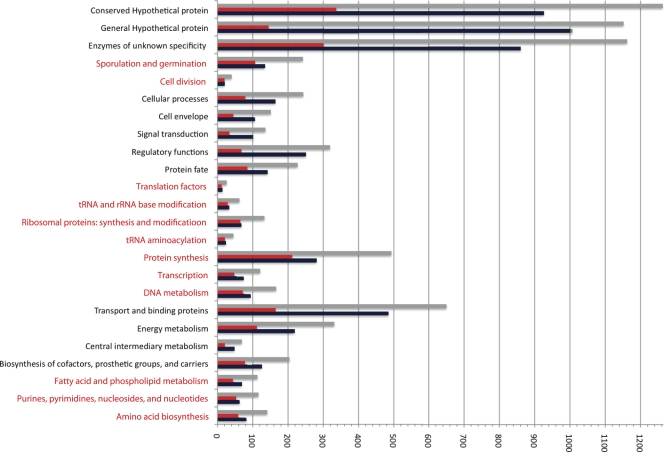
Fig. 8.
Distinct genomic locations for different functional classes of genes in B. megaterium QM B1551. The number of genes classified by function that were encoded within the conserved syntenic region flanking the ori (red) was compared to the number present in the remainder of the chromosome (green), according to Fig. 1, and to the total chromosomal number (gray). Those functions concentrated in the conserved region that were compared to the remainder of the functions are lettered in red.

