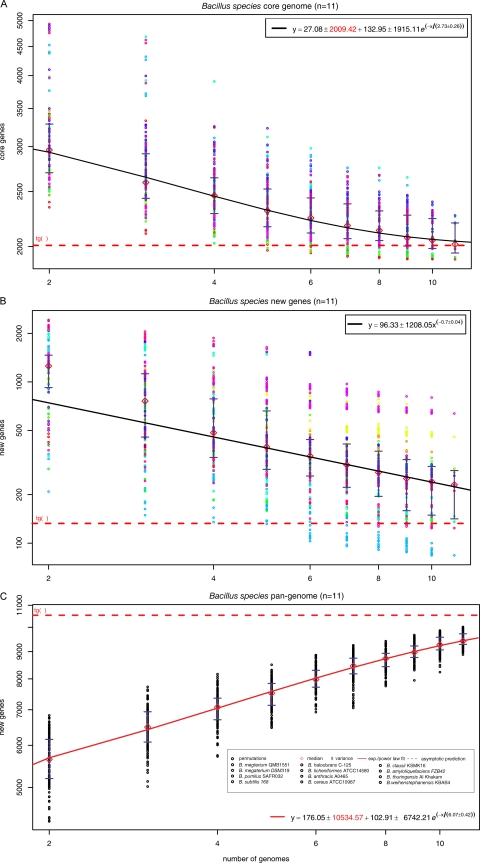
Fig. 9.
Pan-genome analysis and genomic plasticity in the Bacillus group of organisms. (A) Core genes. For each reported number of genomes (n), the circles represent the number of genes in common in different randomly chosen combinations of Bacillus species, with a sampling size of 1,000. Diamonds show the median values for each distribution. The curve represents the exponential regression of the least squares fit of the function Fcore(n) = κc exp[−n/τc] + tgc(θ), based on the medians of the distribution. The extrapolated core genome size is shown as a horizontal dashed red line. (B) Gene discovery. By using the same sampling method as for panel A, the number of new genes found was plotted for increasing values of n. A power law regression for new genes discovered was fitted to the means of new gene counts (diamonds) for each value of n. The curve is the least squares fit of the exponential decay equation Fnew(n) = κn exp[−n/τn] + tgn(θ), based on the means of the distribution. The value of tgn(θ) shown in this figure represents the number of new genes asymptotically predicted for further genome sequencing. (C) The Bacillus pan-genome. The total numbers of genes found according to the pan-genome analyses are shown for increasing values of the number (n) of Bacillus genomes sequenced, using medians and an exponential fit. Red diamonds indicate the means of the distributions. The dashed line represents the asymptotic prediction of the total number of genes expected to be found in the Bacillus pan-genome.

