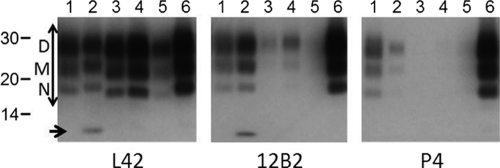
Fig. 2.
Inspection of N-terminal epitope abundance with MAbs P4 and 12B2 relative to the PrP core L42 epitope. Lane 1, AU05; lane 2, reference H BSE; lane 3, C-type reference; lane 4, AU04; lane 5, AU02; lane 6, classical scrapie. Applied tissue equivalent (milligrams of tissue per lane) (TE) for lanes 1 to 4, 0.5 mg; for lane 5, 2.5 mg; for lane 6, 0.25 mg. The positions of the D, M, and N triple glycoprofile bands are indicated. The region for glycoprofile estimation is indicated with a double-headed arrow. The migration positions of three molecular mass standards are indicated in kDa. The M position coincides with the referred migration at 22 kDa (Fig. 1). A 7-kDa fragment is observed in H BSE samples (arrow).

