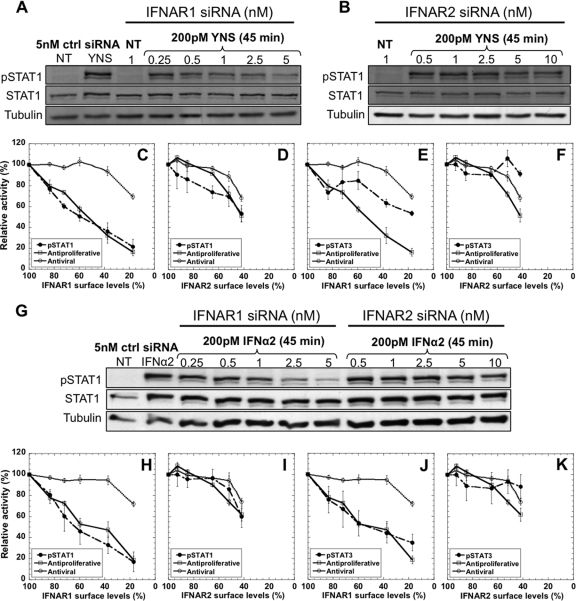
Fig. 7.
pSTAT1 and pSTAT3 levels upon transfection with siRNA followed by treatment with YNS or IFN-α2. pSTAT1 protein levels as induced by 200 pM of YNS or IFN-α2, after 48 h transfection with either control (ctrl) siRNA or various concentrations of IFNAR1 (A and G) or IFNAR2 (B and G) siRNAs. The same amounts of total protein extracts were loaded per lane (30 μg) and verified by α-tubulin levels. NT, nontreated. Correlations between pSTAT1 levels, antiproliferative activity, and antiviral activity upon IFNAR1 or IFNAR2 downregulation are shown in panels C and D for YNS treatment and panels H and I for IFN-α2 treatment. pSTAT1 levels were normalized to STAT1 total protein. Correlations between pSTAT3 levels, antiproliferative activity, and antiviral activity upon IFNAR1 or IFNAR2 downregulation are shown in panels E and F for YNS treatment and panels J and K for IFN-α2 treatment. pSTAT3 levels were normalized to STAT3 total protein. Error bars represent the standard deviations of results from at least two independent experiments.

