
Fig. 8.
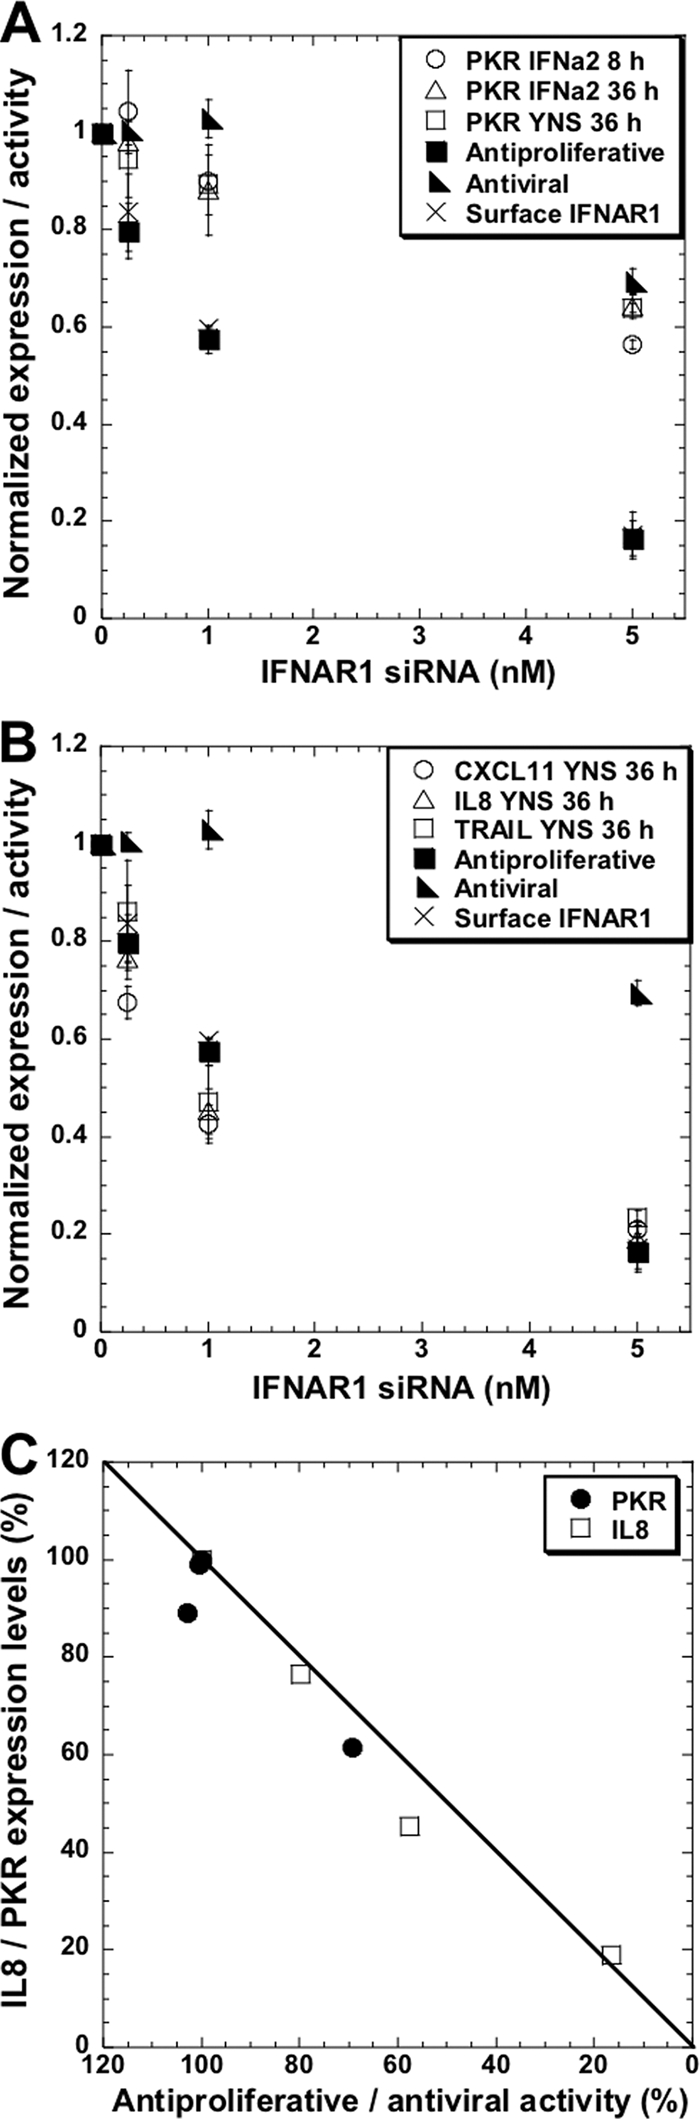
Transcription levels of interferon-stimulated genes upon IFNAR1 knockdown. The expression levels of several interferon-stimulated genes upon 48 h of transfection with IFNAR1 siRNA followed by 8 or 36 h of 50 pM WT IFN-α2 or YNS treatments were monitored by qPCR. (A) A minor decrease in PKR induction upon IFNAR1 knockdown. Notice that the decrease in PKR expression is in line with the reduction in the antiviral activity. (B) The decrease in the induction of several antiproliferative genes (the CXCL11, IL-8, and TRAIL genes) is in line with both the reduction in antiproliferative activity and the reduction in IFNAR1 receptor levels. (C) A linear correlation between the expression of an antiviral gene (the PKR gene) or an antiproliferative gene (the IL-8 gene) with their related biological responses. Error bars represent the standard deviations of results from at least two independent experiments.