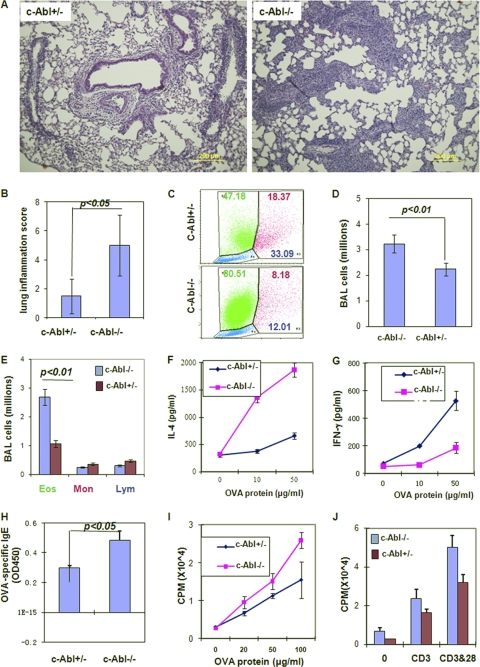
Fig. 7.
The development of allergic lung inflammatory disease in c-Abl−/− and c-Abl+/− mice. c-Abl−/− mice and their heterozygous littermates were immunized with OVA/Alum and aerosol challenged once with OVA. (A) The lung sections were analyzed by H&E staining, and representative images were selected. (B) The inflammation of lung sections was scored. Error bars represent data from five mice per group. Student's t test was used for the statistical analysis. (C) Forward-scatter and side-scatter profiles of cell populations in bronchoalveolar lavage (BAL) fluid. Numbers indicate percentages of eosinophils (green), monocytes (magenta), and lymphocytes (blue). (D and E) Total numbers of BAL fluid cells (D) and the numbers of eosinophils (Eos), monocytes (Mon), and lymphocytes (Lym) (E) were calculated based on their average percentages. (F and G) Total splenocytes from immunized mice were stimulated with different amounts of OVA antigen for 24 h. The production of IL-4 (F) and IFN-γ (G) was analyzed by ELISA. (H) The levels of OVA-specific IgE in the sera from immunized mice were analyzed. (I and J) Total lymphocytes from immunized mice were cultivated with different amounts of OVA antigen for 3 days (I). Purified T cells from these mice were stimulated with anti-CD3 or anti-CD3 plus anti-CD28 for 3 days (J). The proliferation of these T cells was analyzed by [3H]thymidine incorporation.

