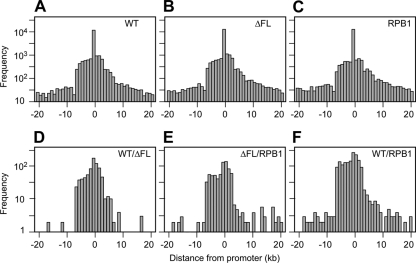
Fig. 6.
Distribution of ChIP signals or CMARRT regions relative to TSSs. The regions tiled in the array were classified into subsets, eliminating regions of <10 kb and >500 kb. The distance of the nearest TSS was calculated for each of the IPs and was plotted as a function of distance upstream or downstream from the nearest promoter. If a promoter was present within a CMARRT region, then the distance from the promoter to the region was assigned as zero. The total number of signals used for each condition to generate each plot is presented in Table S2 in the supplemental material. The nearest promoter was identified as described in Materials and Methods. (A) WT; (B) ΔFL; (C) RPB1; (D) WT/ΔFL ratio; (E) ΔFL/RPB1 ratio; (F) WT/RPB1 ratio.

