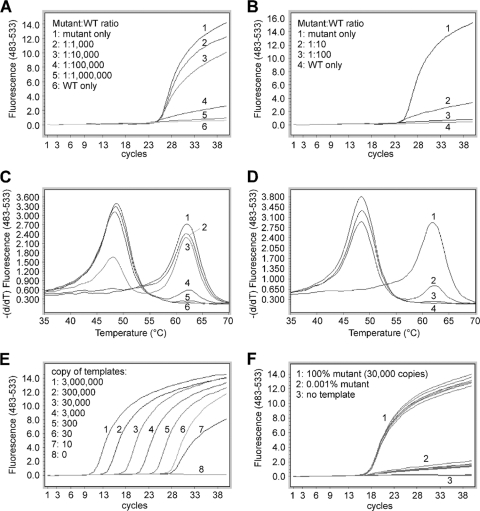
Fig. 4.
Quantification of A1762T/G1764A mutation by a two-step SimpleProbe PCR. (A to D) Templates containing 300 copies of A1762T/G1764A mutant, with and without WT plasmids at different ratios, were first amplified in the presence (A and C) or absence (B and D) of the WT-selective PCR blocker for 20 cycles and then amplified in a SimpleProbe PCR. The amplification curves are shown in panels A and B, and the corresponding melting curves are in panels C and D. (E) Amplification of known concentrations of A1762T/G1764A plasmids as concentration standards. (F) Seven identical siPCRs for 30,000 copies of A1762T/G1764A plasmid alone (line group 1) or 0.001% mutant plasmid (line group 2) were done with SimpleProbe PCR to assess the reproducibility.

