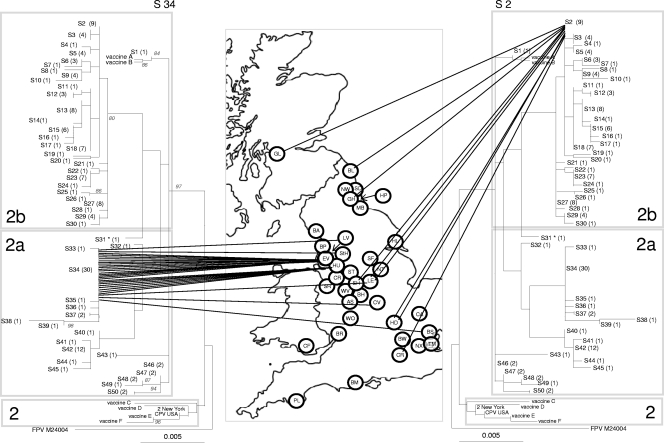
Fig. 1.
Phylogenetic analysis of the CPV VP2 DNA sequences in the United Kingdom. Highlighted are the geographical distribution of two different sequence types, S34 (left) and S2 (right). The phylogenetic tree is based on maximum likelihood with bootstrap support for individual nodes indicated at appropriate nodes (for clarity they are only included on the left-hand tree). In all trees, each sequence type is labeled with its number followed by the number of identical sequences within that group (e.g., S3 (4), indicating that sequence type 3 contains 4 identical sequences). On the map, a circle represents the approximate location in the United Kingdom of each individual hospital where a CPV-positive sample was obtained (for key to hospital origin codes see Table 1). Lines connecting sequences to their geographical origin link the map to the phylogeny. The classification of viruses as CPV-2, -2a, and -2b, as indicated by the shading on each tree, are a classification based on key amino acid mutations (see text). To save space, the same tree is shown in mirror image on either side of the map.

