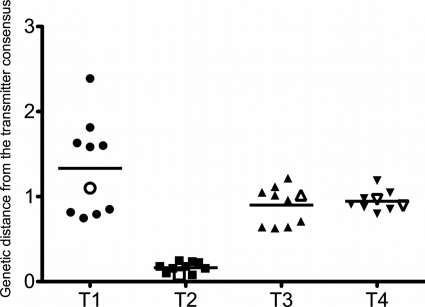
Fig. 2.
The recipient founder virus is typical of the viral population in the transmitter. Distribution of genetic distances between the 10 transmitter sequences obtained near the time of transmission and the corresponding consensus sequence in the transmitter is shown. The line represents the mean genetic distance for each transmitter. The transmitter sequence that was the closest (had the lowest pairwise genetic distance) to any recipient sequence at visit 1 is represented as an open symbol. For pair T4-R4, two variants established infection in the recipient, so the transmitter sequence closest to each variant is shown. T2 was acutely infected at the time of transmission to R2.

