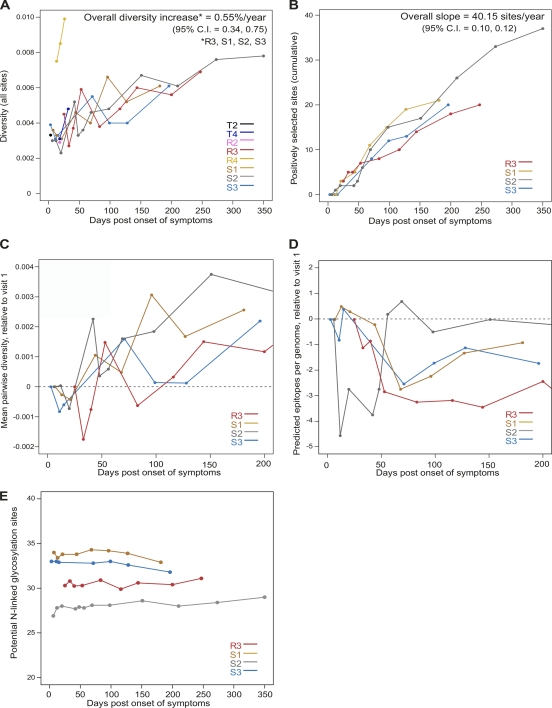
Fig. 3.
Trends in genetic diversity, positive selection, potential N-linked glycosylation, and epitope number. (A) Mean pairwise nucleotide diversity across genomes (corrected with the Hasegawa-Kishino-Yano [HKY] substitution model). (B) Cumulative number of amino acid sites under positive selection as identified by FEL or the simulation method of Liu et al. (41). Only positively selected sites at which two or more mutations occur at the same time point were counted (in order to better identify the beginning of selective events). (C) Mean pairwise nucleotide diversity across genomes; values for each time point are reported relative to those found in the first sampled time point (visit 1). (D) Mean number of epitopes predicted by the Epipred algorithm over the first 200 days after symptoms; as in panel C, values for each time point are relative to the first sampled time point. The dashed lines cross zero. (E) Potential N-linked glycosylation sites.

