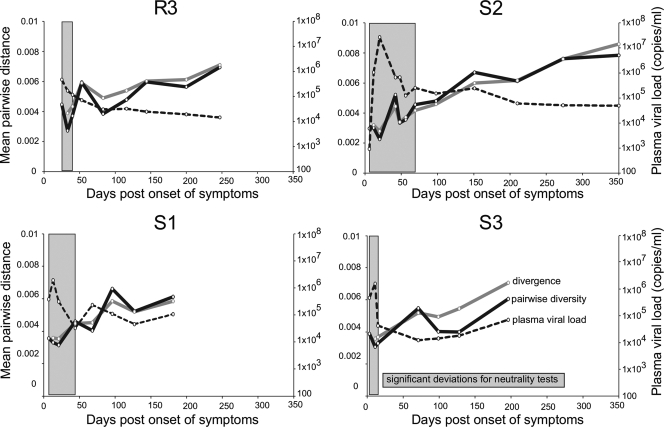
Fig. 4.
Stochastic processes predominate during acute HIV-1 infection. Plots for four individuals followed from 3 up to 350 days postonset of symptoms. Trends in pairwise diversity and divergence from the first visit consensus for genome nucleotide alignments are shown along with plasma viral RNA load over the same period (the legend is shown in the S3 panel). Times during which significant negative deviations for Tajima's D and Fu and Li's D* neutrality tests were detected are shown in shaded blocks.

