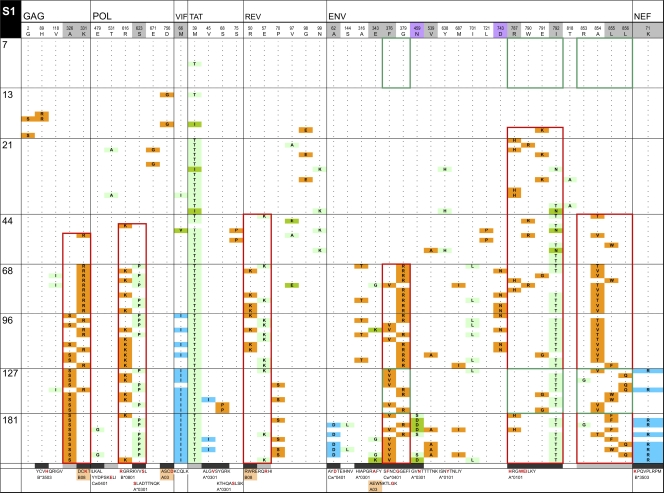
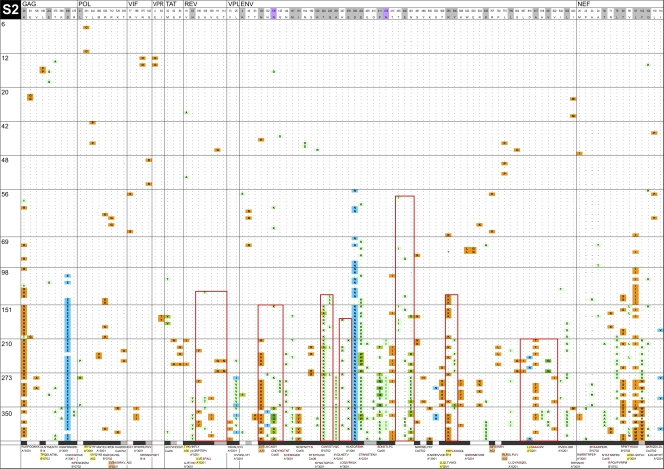
Fig. 5.
InSites diagrams of genomes from longitudinal samples. The figure shows the alignment of phylogenetically informative sites identified in genome sequences relative to the visit 1 consensus sequence in the recipient. Genome sequences from different time points are separated by horizontal lines; days postonset of symptoms are displayed on the left of each row. The header row includes the visit 1 consensus sequence with HXB2 numbering, shaded in gray for positively selected sites (as detected by FEL or by a simulation approach [41, 53]) and in purple for putative N-linked glycosylation sites. The bottom row shows known or potential epitopes predicted by NetMHC (unshaded), by Epipred (shaded in coral), or by both methods (in yellow). Amino acid sites within epitopes are shaded in black; amino acid sites located near known or predicted epitopes (up to 5 aa away) are shaded in gray. Green boxes surround HIV-1 segments recognized by IFN-γ ELISPOT responses. Red boxes surround mutually exclusive mutation patterns. Orange cells represent forward mutations (decrease in database frequency of the amino acid by 50% or more), blue cells represent reverse mutations (increase in database frequency of the amino acid by 50% or more), and green cells represent less substantial changes in database frequency.


