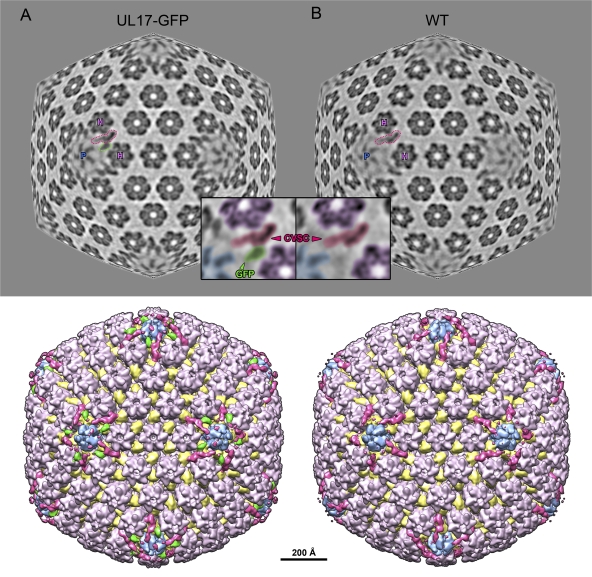
Fig. 5.
Visualizing the GFP tag on UL17-GFP capsids. Density maps calculated from C capsids with GFP-labeled UL17 (A) and wild-type C capsids with unlabeled UL17 (B). Radial sections partway between spherical and icosahedral (70%) through each map, at a radius of 565 Å at the icosahedral 3-fold axis, are shown at the top, with surface-rendered views beneath. Views are along the icosahedral 2-fold axis. In the sections, a penton and its two adjacent hexons are labeled with “P” and “H,” respectively, and a CVSC density is outlined in magenta. In the UL17-GFP map section, additional density is seen coming off the CVSC and is outlined in green. Insets show close-up views of the CVSC outlined in the sections. The densities have been shaded so that the penton is blue, hexons are purple, the CVSC is magenta, and extra density in the tagged map, which we attribute to GFP, is green. Surface views of the capsid beneath the sections have been color coded as described above, with triplexes in yellow.

