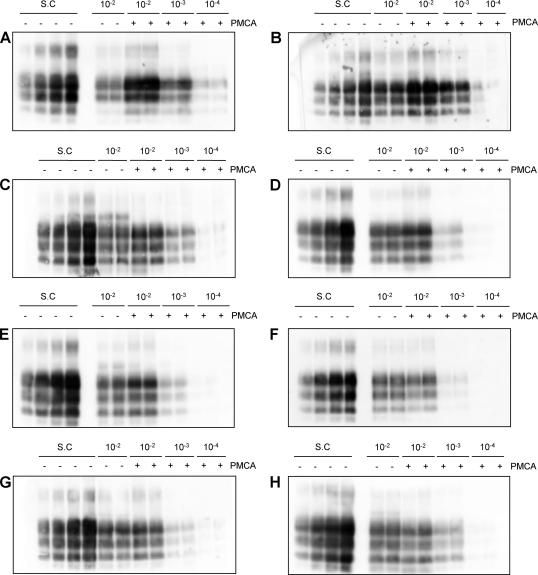
Fig. 2.
Comparison of PMCA conversion efficiencies of different substrates. Representative WBs used to calculate the amplification factor for each genotype are shown. (A) ARQ/ARQ; (B) ARQ/AHQ; (C) AHQ/ARH; (D) ARQ/ARR; (E) ARR/ARR; (F) ARQ/AT137RQ; (G) ARQ/ARQK176; (H) ARQK176/ARQK176. In each blot the standard curve (S.C) and duplicates of serial dilutions of the inoculum in each substrate are loaded before (−) and after (+) one round of PMCA.

