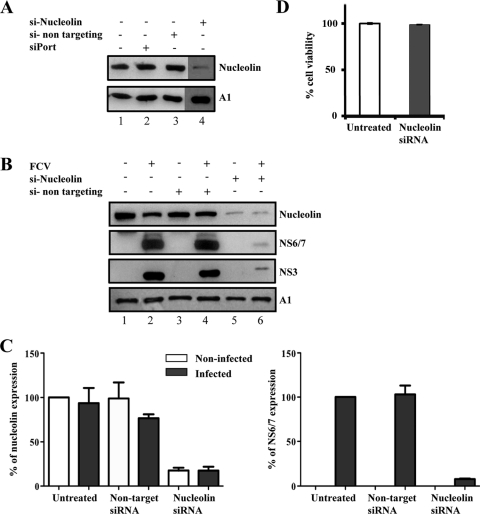
Fig. 7.
Effect of nucleolin silencing on the expression of FCV NS6/7. (A) CrFK cells were either left untreated (lane 1), treated with siPort reagent alone (lane 2), or transfected with a nontargeting siRNA (lane 3) or with two siRNAs specific for feline nucleolin (lane 4). The levels of nucleolin expression were evaluated by Western blotting. (B) CrFK cells were either not treated (lanes 1 and 2) or transfected with a nontargeting siRNA (lanes 3 and 4) or with two siRNAs specific for feline nucleolin (lanes 5 and 6) for 48 h. Cells were then either mock infected or infected with FCV (MOI 10) for 5 h, and the expression levels of nucleolin, FCV NS6/7, NS3 or p39, and hnRNP A1 (A1), used as the loading control, were evaluated by Western blotting in FCV-infected (lanes 2, 4, and 6) and uninfected (lanes 1, 3, and 5) cells. (C) Nucleolin and NS6/7 band intensities were quantified by densitometric analysis using Quantity-One software (Bio-Rad) and are expressed as the percentage in relation to the hnRNP A1 expression level. Error bars represent the standard deviation from three independent experiments. (D) Forty-eight hours after siRNA transfection, cell viability of untreated and nucleolin siRNA-treated cells was measured as described in Materials and Methods. Error bars show standard deviations.

