
Fig. 1.
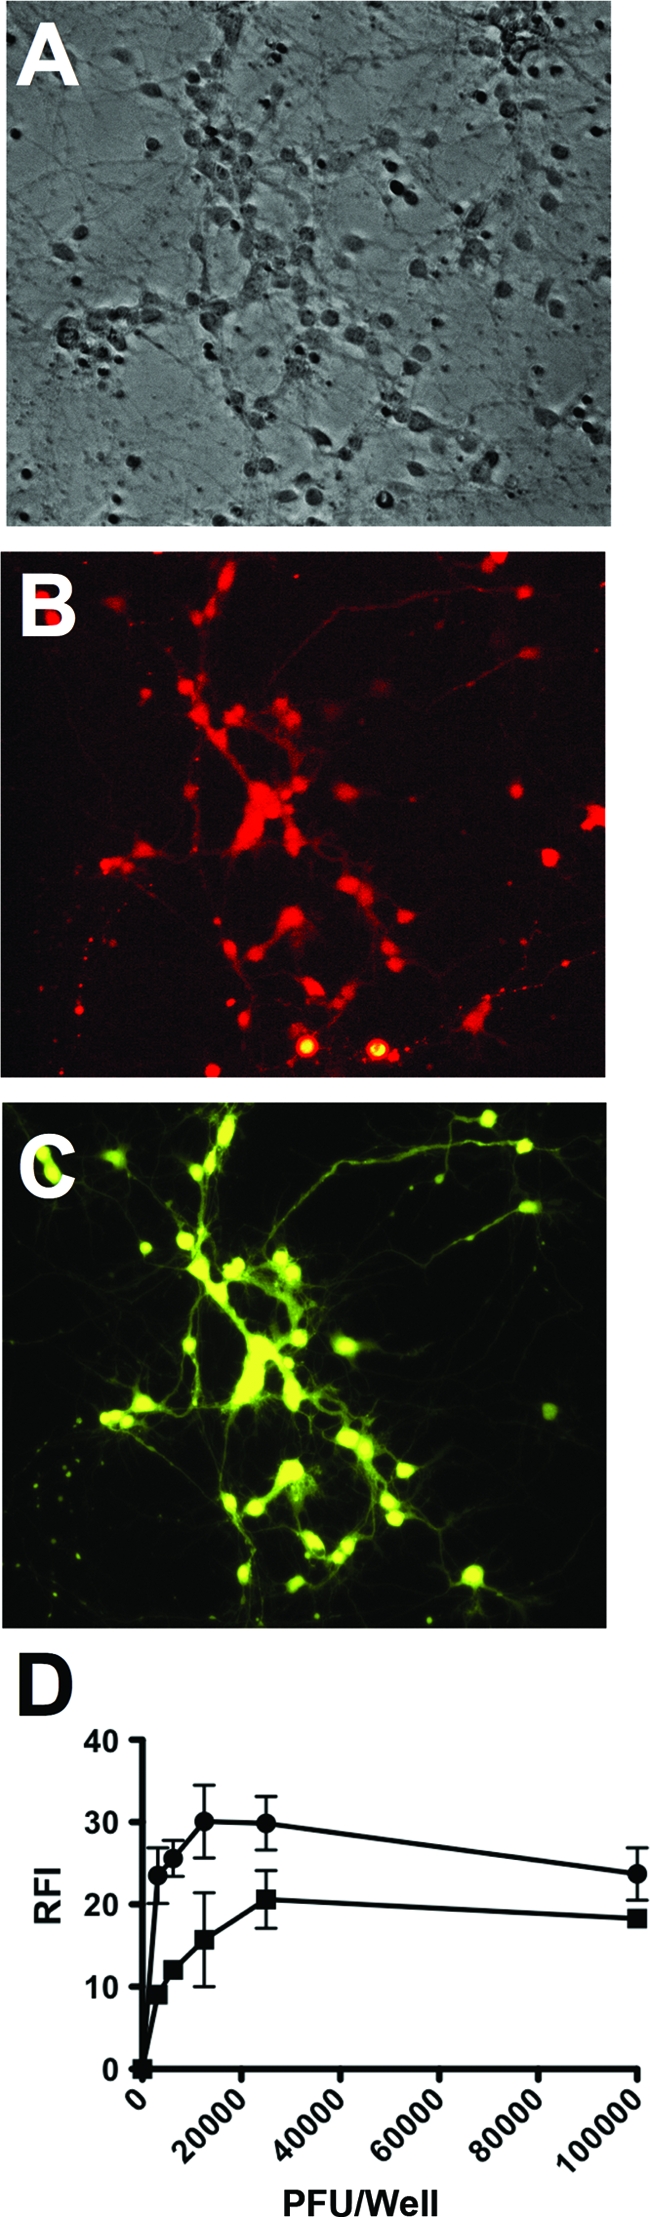
Transfection and infection of primary neurons with pseudotyped NiV. Panel A shows neurons transfected with NiV G/F and then infected with pseudotyped NiV. Panel B shows fluorescence (RFP) in neurons due to infection with RFP-expressing NiV pseudotyped viruses. Panel C shows fluorescence in neurons reflecting transfection with YFP. In panel D, pseudotyped NiV expressing RFP (numbers of PFU/well; x axis) were used to infect transfected (circles) or untransfected (squares) neurons. At 72 h postinfection, the relative fluorescence intensity (RFI) of the RFP was measured (y axis). The data represent 3 replicates, with standard deviations.