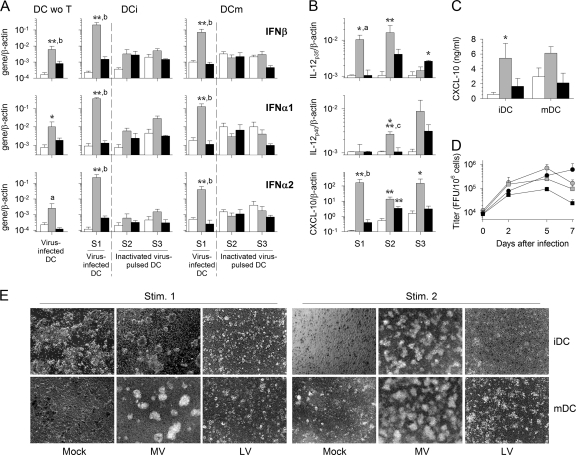
Fig. 1.
Activation of infected DC and cooperation with T cells. (A) The expression of IFN-β (top), IFN-α1 (center), and IFN-α2 (bottom) mRNA was quantified 2 days after the first (S1), second (S2), and third (S3) stimulations in mock (open bars)-, MV (shaded bars)-, or LV (filled bars)-infected iDC and mDC. Whereas the first stimulation of T cells was performed using MV- or LV-infected DC, the second and third stimulations were performed using inactivated-virus-stimulated DC. Type I IFN mRNA production by mock-, MV-, or LV-infected iDC cultured without T cells (DC wo T) is also shown. Results are expressed as the gene/β-actin ratio. (B) Expression of IL-12p35, IL-12p40, and CXCL-10 mRNA by iDC 2 days after the first, second, and third stimulations. (C) The amounts of CXCL-10 released by iDC and mDC cultured with T cells were quantified by ELISA 2 days after the first stimulation. Results, expressed in nanograms per milliliter, are means and SEM from five independent experiments using different donors. Significant differences between mock-infected and infected cells are indicated by asterisks (*, P < 0.05; **, P < 0.01; ***, P < 0.001), and significant differences between Mopeia and Lassa virus-infected cells are indicated by lowercase letters (a, P < 0.05; b, P < 0.01; c, P < 0.001). (D) Titration of MV (shaded symbols) and LV (filled symbols) particles in culture supernatants after the first stimulation of T cells with MV- or LV-infected iDC (circles) or mDC (squares). Results, expressed in focus-forming units per 106 cells, are means and SEM from five independent experiments using different donors. (E) Microscopic photographs of mock-, MV-, or LV-infected cocultures of T cells with iDC or mDC 4 days after the first stimulation (Stim. 1) and of T-cell cocultures with iDC or mDC that were either mock stimulated or pulsed with inactivated MV or inactivated LV 6 days after the second stimulation. Magnification, ×60.

