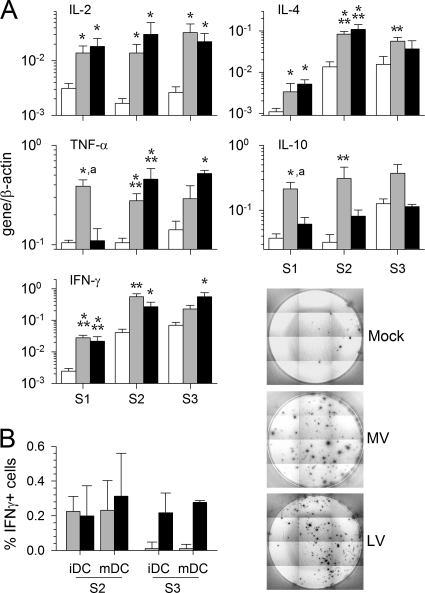
Fig. 6.
mRNA synthesis and cytokine production after MV or LV infection. (A) Cytokine mRNA synthesis was evaluated by qRT-PCR 2 days after each round of stimulation (S1 to S3) in T cells cultured with mock (open bars)-, MV (shaded bars)-, or LV (filled bars)-infected iDC. The means and SEM from five independent experiments using different donors are shown. Results are expressed as gene/β-actin ratios. Significant differences are indicated as for Fig. 1. (B) Determination of the number of IFN-γ-producing T cells by ELISPOT assay. (Left) The graph shows the number of spots for 104 T cells that were first stimulated with MV- or LV-infected iDC or mDC and were then restimulated with MV (shaded bars)- or LV (filled bars)-pulsed DC, respectively, minus the number of spots for T cells stimulated with mock-infected DC. Results were obtained after the second and third stimulations and are represented as means and SEM from five independent experiments using different donors. (Right) Results of a representative experiment to detect IFN-γ production by T cells after the second stimulation with culture medium-, MV-, or LV-pulsed iDC.

