
Figure 3.
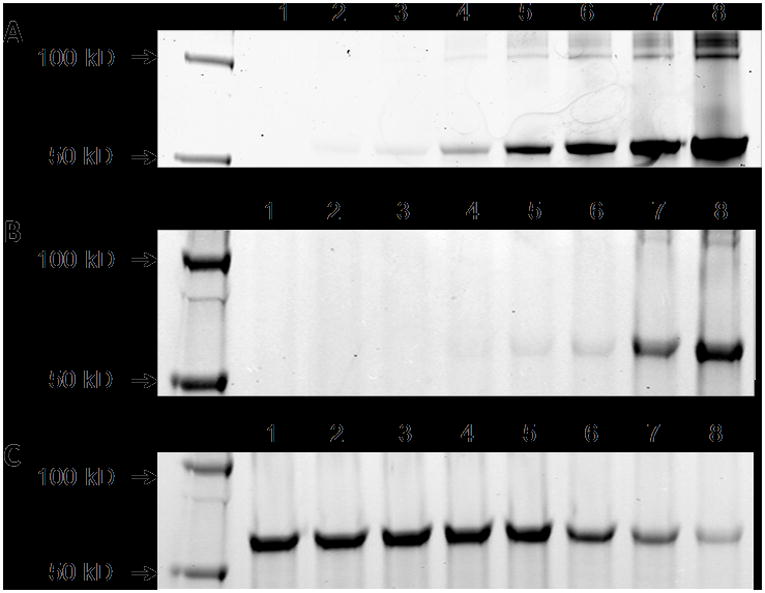
MMP-9 enzyme binding assays. Shown are the fluorescent scans acquired on the LICOR infrared imaging system. In all cases, 10 ng of purified MMP-9 was used and binding was resolved by SDS gel electrophoresis. The binding experiments shown are as follows: MMP-9 was incubated with increasing amounts of M2 (A) and processed M2 (B) at concentrations of 0, 0.1, 0.2, 0.4, 1, 2, 4 and 10 μM (lanes 1–8). For the blocking study (C), MMP-9 was incubated with M1 atconcentrations of 0.2, 0.5, 1, 2, 20, 200, 500 and 1000 μM (lanes 1–8). M2 (2 μM) was then added and incubated for 1 h. Bands resolved at 62 kDa correspond to M2 binding with MMP-9.