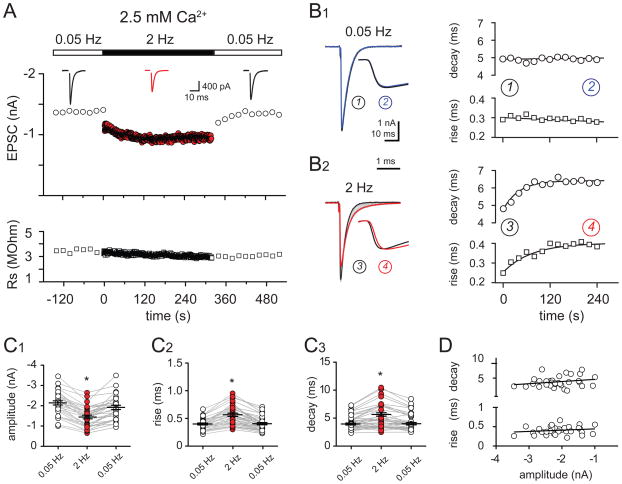
Figure 1. Time course and kinetics of CF-PC EPSCs at physiological firing frequencies.
(A) Top: Time course of CF-PC EPSC peak amplitude evoked at 0.05 Hz (open circles) or at 2 Hz (red circles) in 2.5 mM external [Ca2+]; (inset) averaged EPSCs during 0.05 Hz (black traces) and 2 Hz (red trace) CF stimulation. Bottom: Series resistance (open squares) for the EPSCs shown above.
(B1 and B2) Left: Superimposed EPSCs during 0.05 Hz (b1) and 2 Hz (b2) stimulation. Traces are the average of EPSCs at the beginning (black, 1 or 3), during (grey), and at the end (blue or red, 2 or 3) of a two minute stimulation period; (inset) rising phase of the normalized peak-amplitude EPSC in expanded time. Right: Time course of the decay time constant (circles) and rise time (squares) of EPSCs evoked with 0.05 Hz (top) or 2 Hz (bottom) stimulation. Linear regression (0.05 Hz) or a one-phase association curve (2 Hz) was used for line fits.
(C1 – C3) Summary data in 2.5 mM external Ca2+ shows the reduction of the EPSC peak amplitude (c1), the increase of the EPSC 20–80% rise time (c2), and decay time (c3) that occurs with 2 Hz CF-stimulation (red circles) compared to 0.05 Hz stimulation (open circles). Each data point represents an individual experiment, black horizontal traces are mean values ± SEM.
(D) No correlation between the kinetics and amplitude of 0.05 Hz stimulated EPSCs. Linear fit indicates no correlation between rise or decay time and EPSC peak amplitude (n = 30; p = 0.20 and 0.32 for the decay and the rise times, respectively).

