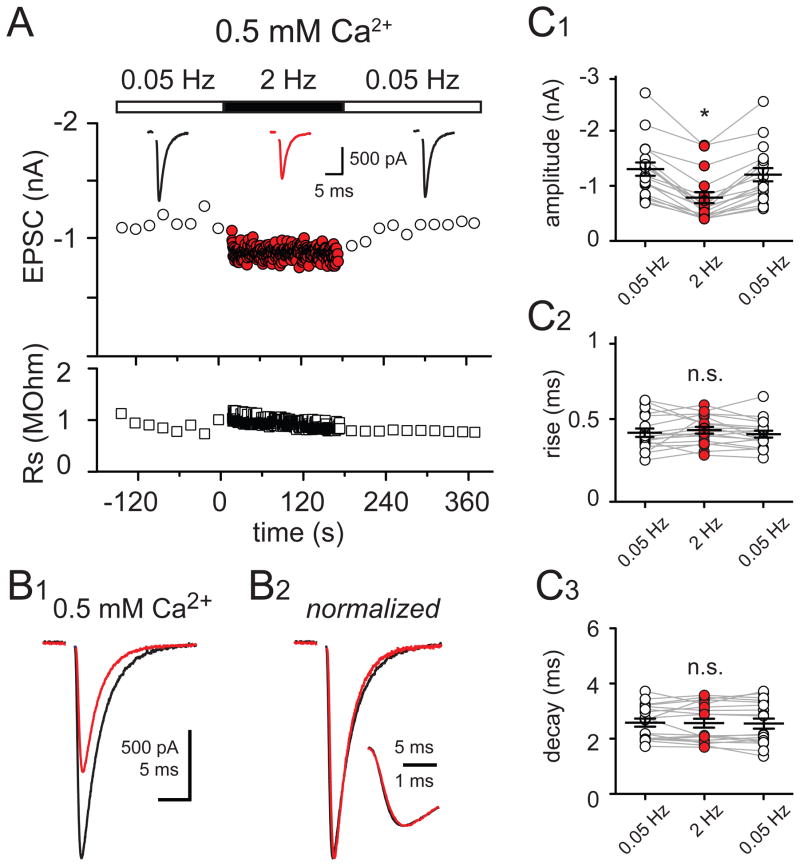
Figure 2. Kinetic changes during 2 Hz CF-stimulation require multivesicular release.
(A) Top: Time course of CF-PC EPSC peak amplitude at 0.05 Hz (open circles) or 2 Hz (red circles) in 0.5 mM external Ca2+; (inset) averaged EPSCs taken at the end of 0.05 Hz (black traces) and 2 Hz (red trace). Bottom: Time course of the series resistance (open squares) for the EPSCs shown above.
(B1) Superimposed averaged EPSCs evoked after two minutes of 0.05 Hz stimulation (black trace) or 2 Hz stimulation in 0.5 mM external [Ca2+].
(B2) Responses in (B1) normalized to the peak amplitude; (inset) rising phases of the EPSCs in (B2) shown in expanded time.
(C1 – C3) Summary data of experiments performed in 0.5 mM external Ca2+ shows the reduction of the EPSC peak amplitude that occurs with 2 Hz CF stimulation (C1) but no change in the EPSC rise time (C2) or decay time (C3) with 2 Hz CF stimulation (red) compared to those during 0.05 Hz stimulation (open circles).

