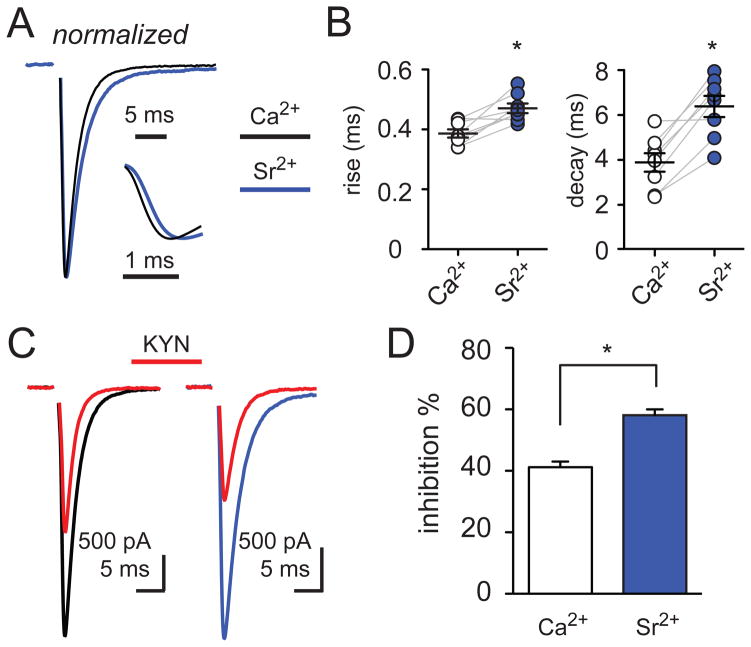
Figure 4. Strontium desynchronizes and reduces the peak synaptic [glutamate].
(A) Superimposed peak-scaled CF-PC EPSCs in Ca2+ (2 mM; black) and Sr2+ (5 mM; blue); (inset) rising phase of the EPSCs shown in expanded time.
(B) Summary data shows the increase in the rise (left) and decay (right) times of EPSCs in external Ca2+ (open circles; 0.38 ± 0.01 ms and 3.9 ± 0.41 ms, respectively) and Sr2+ (blue; 0.47 ± 0.02 and 6.4 ± 0.47 ms, respectively). Each data point represents individual experiments and black horizontal traces are mean values ± SEM.
(C) Superimposed CF-PC EPSCs in Ca2+ (left; black), in Sr2+ (right; blue), and the inhibition by 1 mM KYN (red) following 0.05 Hz stimulation.
(D) Summary of EPSC inhibition by 1 mM KYN in Ca2+ (open bar) and Sr2+ (blue).

