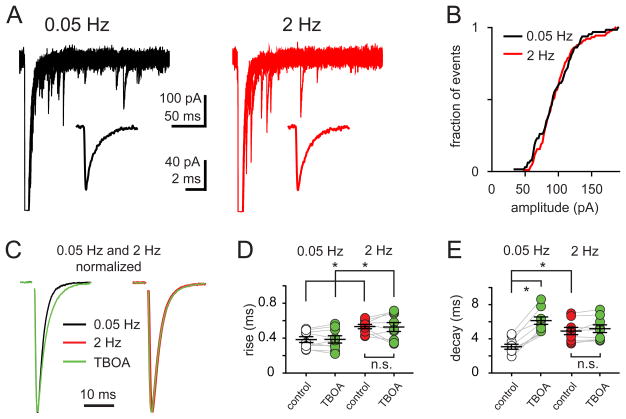
Figure 5. Activity-dependent EPSC kinetic changes are not due to decreased quantal size, altered quantal kinetics, or glutamate pooling.
(A) Superimposed traces of aEPSCs in response to 0.05 Hz (A, black) and 2 Hz (B, red) stimulation in 0.5 mM Sr2+; (insets) average aEPSCs collected from 50 – 100 stimuli delivered at each frequency. The rise (0.12 ± 0.07 ms versus 0.11 ± 0.05 ms) and decay times (1.44 ± 0.11 ms versus 1.41 ± 0.14 ms) at 0.05 Hz and 2 Hz, respectively, were not significantly different.
(B) Cumulative probability distribution of aEPSC amplitudes collected during 0.05 Hz (black) and 2 Hz (red) stimulation in 0.5 mM Sr2+ from a representative cell. Similar results were found in eleven cells tested.
(C) Superimposed peak-scaled 0.05 Hz- (left) and 2 Hz- (right) EPSCs in the absence (black) or in the presence of the glutamate transporter antagonist TBOA (50 μM, green).
(D and E) Summary data shows the rise (D), and decay times (E) of EPSCs evoked at 0.05 Hz or 2 Hz in the absence (open and red, respectively) or the presence of TBOA (50 μM; green). TBOA did not affect the rise time (0.38 ± 0.03 ms to 0.38 ± 0.04 ms) but prolonged the decay time of EPSC0.05Hz (from 3.8 ± 0.3 to 6.1 ± 0.4 ms in TBOA). TBOA neither changed the EPSC2Hz rise (0.53 ± 0.02 ms and 0.52 ± 0.05 ms) or decay (from 4.9 ± 0.4 ms and 5.1 ± 0.5 ms in TBOA) times.

