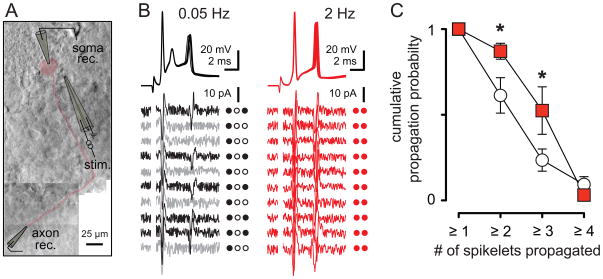
Figure 8. Stimulation frequency controls spikelet propagation probability.
(A) Montage of dual somatic and axonal recording. The PC body and axon is highlighted in red. The recording (rec.) and stimulating (stim.) electrodes are traced for clarity.
(B) Ten superimposed somatically recorded CpSs (top) and corresponding axonal recordings (bottom) during CF stimulation at 0.05 Hz (black and grey) and 2 Hz (red). Black axonal traces indicate successes and grey traces indicate failures of spikelet propagation. Individual spike propagation success (filled circles) and failure (open circles) is also indicated to the right of each trace. Axonal recording site was estimated to be ~175 μm from soma.
(C) Summary data showing the probability of at least ‘x’ spikelets being propagated to the axonal recording site during 0.05 Hz (empty squares) or 2 Hz (red) stimulation.

