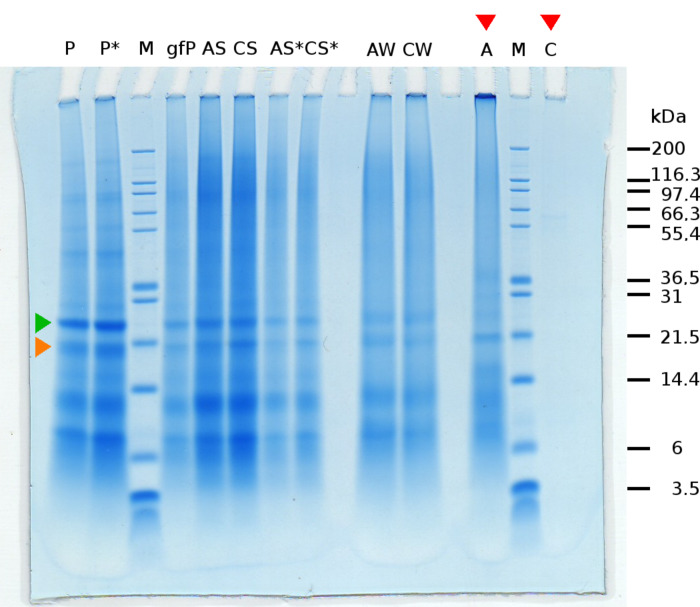
Figure 3.
SDS-PAGE of proteins after different preparational steps as follows. M: marker proteins of known size. P, P*: protein solution of proteins that are insoluble in 6% acetic acid (chitin associated proteins), at two different concentrations. Orange marked band is less intensive than the green marked one. gfP: gel filtered protein solution. AS, CS, AS*, CS*: supernatant of incubated aragonite and calcite crystals, contains unbound proteins, at two different concentrations. AW, CW: combined washings of aragonite and calcite. A, C: acetic acid dissolved crystals after dialysis in sodium citrate buffer. Lane A now shows higher intensity of the orange marked band relative to green marked band, which may indicate specific binding of the orange marked protein to aragonite.

