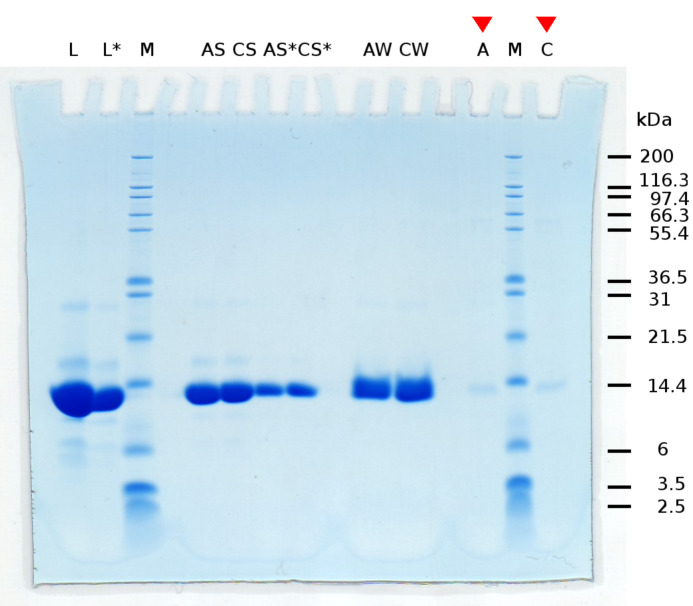
Figure 4.
SDS-PAGE of control experiment with lysozyme. M: marker proteins of known size. L, L*: high concentrated lysozyme solution, at two different concentrations. AS, CS, AS*, CS*: supernatant of incubated aragonite and calcite crystals, at two different concentrations. AW, CW: combined washings of aragonite and calcite. A, C: acetic acid dissolved crystals after dialysis in sodium citrate buffer. Comparing bands in lanes A and C shows no difference in intensity.

