
Figure 5. Genome-wide expression analysis reveals commonly regulated genes in human and rhesus MPBSC (see also Figure S7 and Table S3).
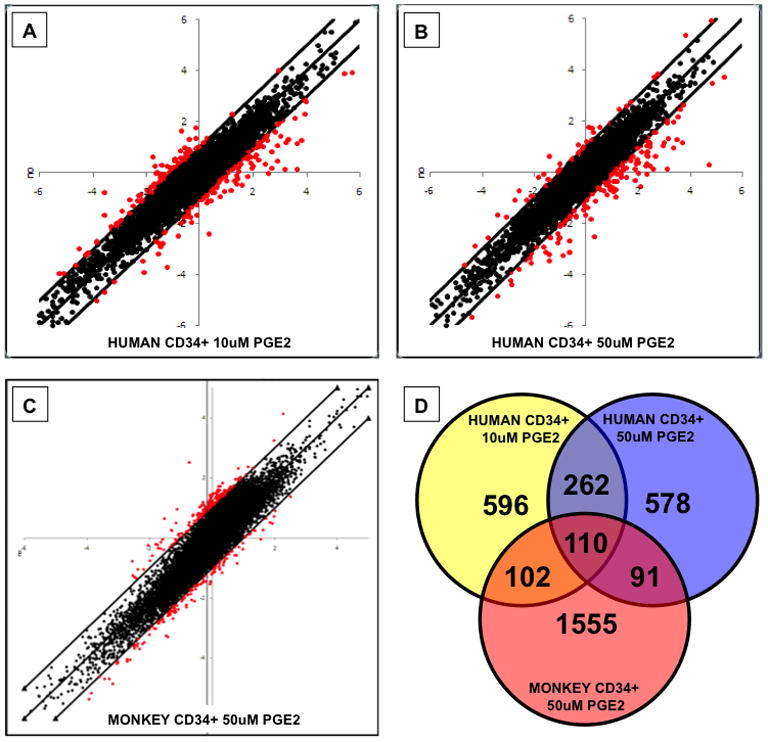
A–C-Scatter plots show genes significantly up- and down-regulated in response to dmPGE2 (x-axis) compared to controls (y-axis). Genes with >2-fold changes are highlighted in red.
D-Schematic display of genes regulated in response to dmPGE2 treatment, showing overlap between treatment groups of MPBSCs.