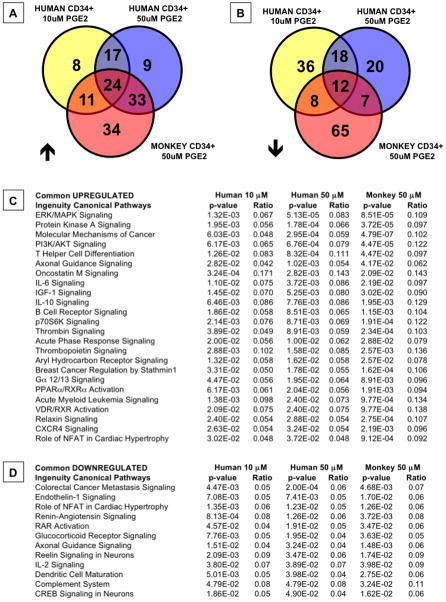
Figure 6. Ingenuity Pathway Analysis reveals conserved response patterns between human and rhesus MPBSCs (see also Tables S4-7).
Microarray data were subjected to Ingenuity Pathway Analysis.
A,B-Venn diagram illustrations of the overlap of significantly up- and down-regulated signaling pathways between humans and rhesus macaques MPBSCs.
C,D-List of significantly up- and down-regulated pathways common between human and rhesus dmPGE2 treated MPBSCs; the ratio indicates the fraction of affected genes of the number of total genes included in each pathway.

