
Figure 7.
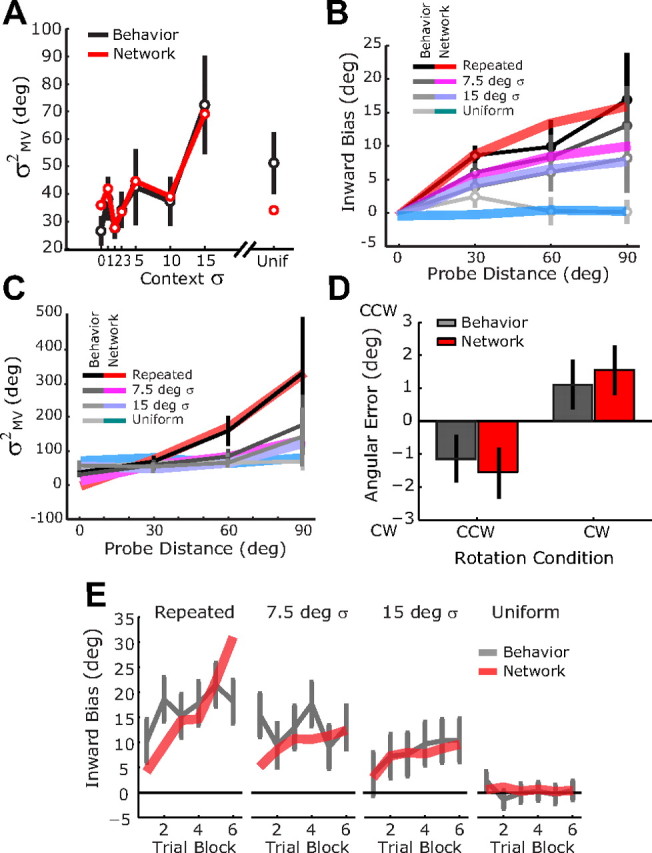
Comparison of network behavior (colored lines) and experimental results (gray lines) when the network is simulated with the same trials sequences that subjects experienced in experiments 1–3. A, Reach variance in experiment 1. B, Reach bias in experiment 2. C, Reach variance in experiment 2. D, Reach bias in experiment 3. E, Evolution of reach bias across trial blocks in experiment 2. Behavioral data are replotted from Figures 2 and 4. The same network parameters were used in all plots and were fitted to the data in A and C.