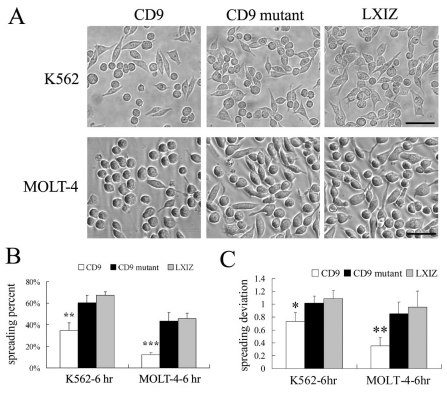
Fig. 3.
CD9 mutation affects cell spreading on fibronectin. (A) K562 and MOLT-4 cells expressing CD9, mutant CD9 and control vector were photographed after spreading on fibronectin for 6 hours. Scale bar: 50 μm. (B) Percent cell spreading was quantified. **P<0.01; ***P<0.001. (C) The deviation of cell spreading was determined by subtracting the value 1.0 (perfect round) from the exact value of cell spreading. At least 50 cells were quantified. Error bars indicate means ± s.d. *P<0.05; **P<0.01.

