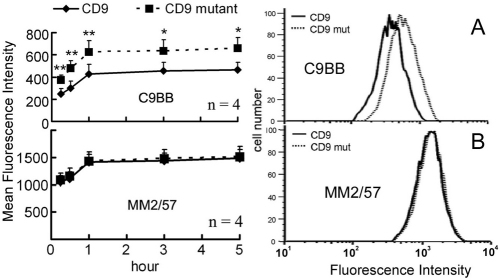
Fig. 8.
CD9 mutation effects on cell-surface organization. RD cells expressing CD9 or mutant CD9 were incubated with 4.0 μg low-affinity anti-CD9 antibody (C9BB, A) or 1.0 μg high-affinity antibody (MM2/57, B) for the indicated times, and CD9 mean fluorescence intensities (MFIs) were plotted. Right panels show representative flow cytometry profiles from the 1 hour time point.

