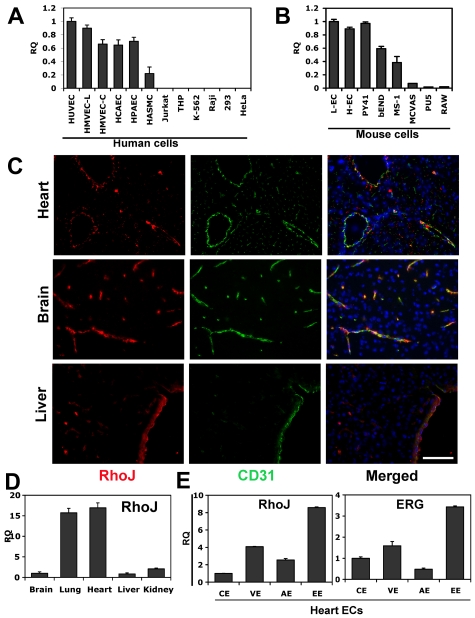
Figure 7.
RhoJ expression is highly enriched in ECs. RNA was extracted from different cell types and QPCR was performed using RhoJ-specific primers (n = 3). (A) RhoJ expression in human ECs and non-ECs. The results are shown relative to HUVECs. Cells used include human ECs: HUVECs, HMVEC-Ls (human lung microvascular ECs), HMVEC-Cs (human cardiac microvascular ECs), HCAECs (human coronary artery ECs), HPAECs (human pulmonary artery ECs) and human non-ECs: HASMCs (human aortic smooth muscle cell ECs), Jurkat, THP, K-562, Raji, 293, and HeLa cells. (B) RhoJ expression in mouse ECs and non-ECs. Cells used include mouse primary ECs isolated from mouse lung (L-ECs) and heart (H-ECs), and the mouse EC cell lines MS-1, bEnd, PY41, and non-EC cell lines MCVAS (mouse smooth muscle cell), PU5, and RAW. The results are shown relative to L-ECs. (C) Representative images of immunofluorescent staining of RhoJ in mouse brain, liver, and heart. Tissues represent frozen sections stained for RhoJ (red), CD31 (green), or DAPI (blue). Magnification 40×. Scale bar indicates 75 μm. (D) Examination of RhoJ expression in mouse tissues. RNAs were extracted from a variety of mouse tissues. cDNA were prepared from RNAs and used in QPCR. RhoJ expression was analyzed using RhoJ-specific primers and normalized against TBP (n = 3). The data are shown relative to brain. (E) Mouse heart was collected and sectioned, followed by H&E staining. ECs from different vascular beds were isolated using laser capture microdissection LMD. RNA was extracted and gene expression of RhoJ and ERG was analyzed by QPCR using specific primers. The data are presented as a ratio compared with VE-cadherin to normalize the EC numbers captured in LMD. EE indicates endocardial ECs; VE, venule ECs; AE, artery ECs; and CE, capillary ECs (n = 3).

