
Figure 6. Synchrony between the pulvinar complex and visual cortex.
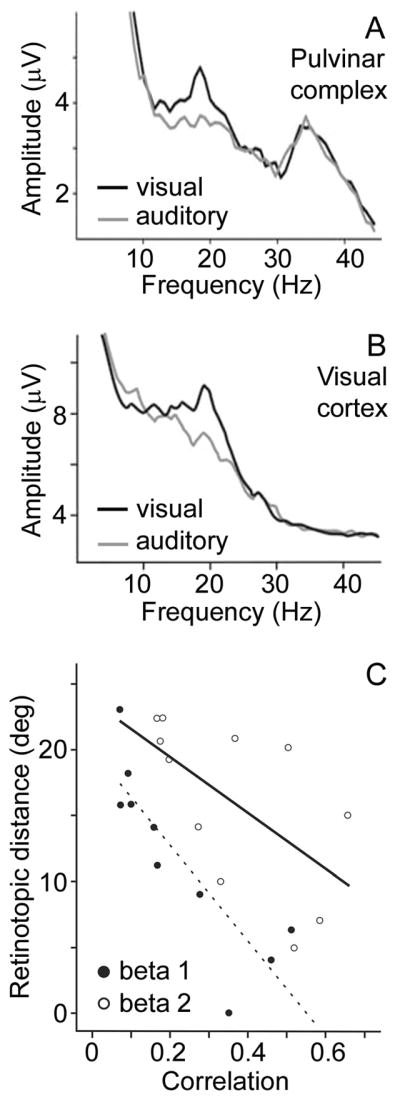
Power in the beta frequency range of the local field potential (LFP) increased in the (A) lateral posterior-pulvinar complex and (B) visual cortex (area 18) when cats performed a spatial discrimination task based on visual rather than auditory cues. (C) Synchrony between the lateral posterior-pulvinar complex and visual cortex was measured as the phase correlation between LFPs at the respective recording sites. Thalamo-cortical synchrony in the beta frequency range increased with increasing similarity of the visual field representations at the recording sites (displayed as retinotopic distance). Beta 1 = 12–19 Hz; Beta 2 = 17–25 Hz. Adapted from Figs. 2, 4 and 7 in Wrobel et al. (2007).