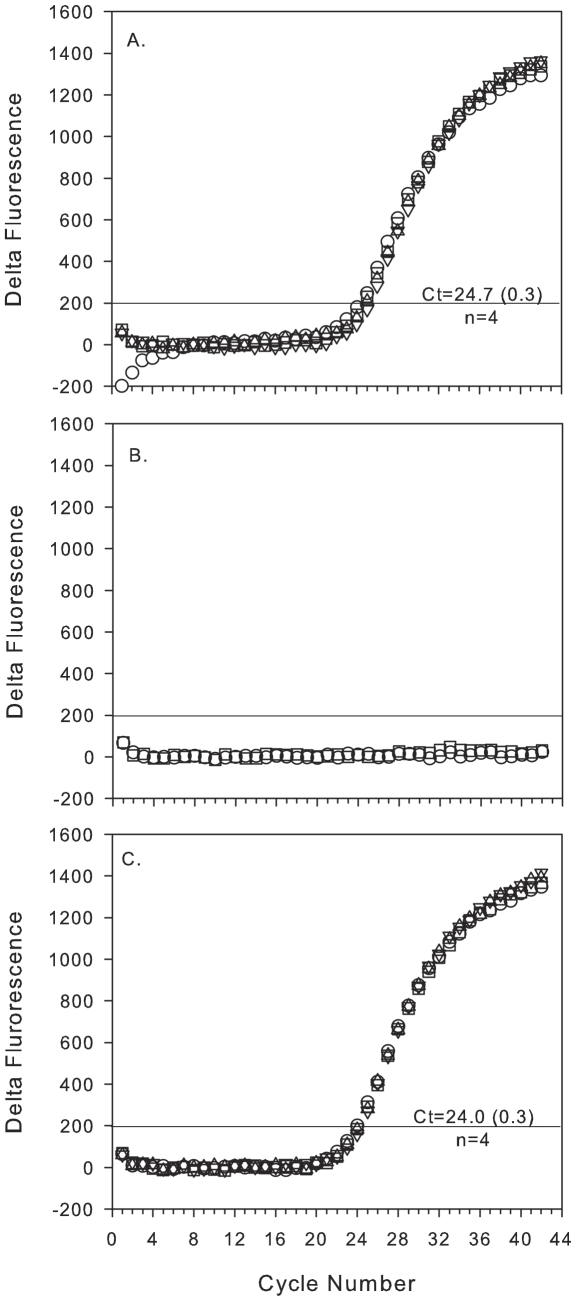
Figure 4. Reproducibility and performance of the decontamination protocols between replicate field samples analyzed by the MFB.
Panels show amplification curves of SAR11 16S rRNA genes from samples processed in the following order, field-collected sample (A), NTC (B, squares), a negative lysate (B, circles) and a replicate field sample (C). The above series was repeated a total of three times, only the first series is depicted. The average Ct (at delta fluorescence of 200; horizontal line) and standard deviation of the replicate reactions from one nucleic acid extract is shown for each field sample.

