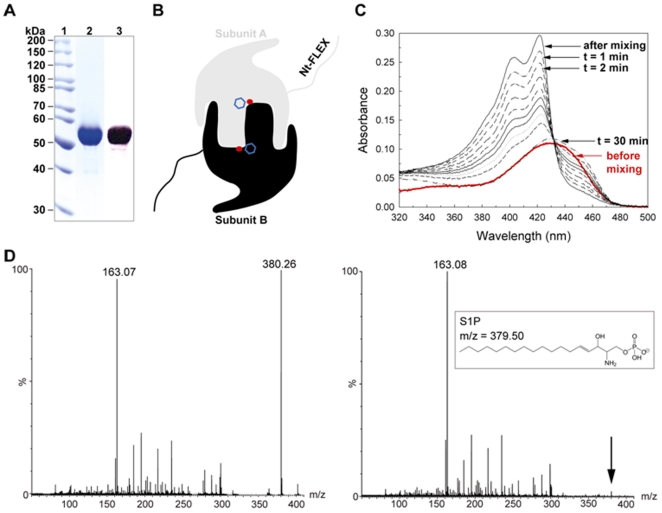
Figure 1. Biochemical characterization of StSPL.
(A) Purity of purified WT StSPL. The molecular weight marker is shown in lane 1, the pooled fractions after size-exclusion chromatography were detected by Coomassie staining of the gel (lane 2) and by Western blotting with an antibody recognizing the C-terminal His-tag (lane 3). (B) Schematic representation of the StSPL dimer. Subunit A is depicted in grey, whereas subunit B is in black. A phosphate ion found in the active site of both subunits is depicted as a red dot, while the cofactor (PLP) is denoted by a blue hexagon. (C) Spectrophotometric activity assay of WT StSPL. The red curve represents the visible spectrum of the native protein before addition of substrate, corrected by the dilution factor. The black curves depict the visible spectra at regular intervals (1 min, 2, 4, 6, 8, 10, 12, 15, and 30 min) after addition of S1P. The transient peaks at 420 and 403 nm appearing upon addition of substrate correlate with protein activity. (D) Mass spectrometric activity assay of WT StSPL. The left panel depicts the reaction mixture measured just after mixing protein and substrate. The m/z 163.07 and 380.26 peaks correspond to the end product phosphoethanolamine and the substrate S1P, respectively. The right panel shows the reaction mixture after 75 min incubation at 20°C. No peak corresponding to S1P was detectable above background level.

