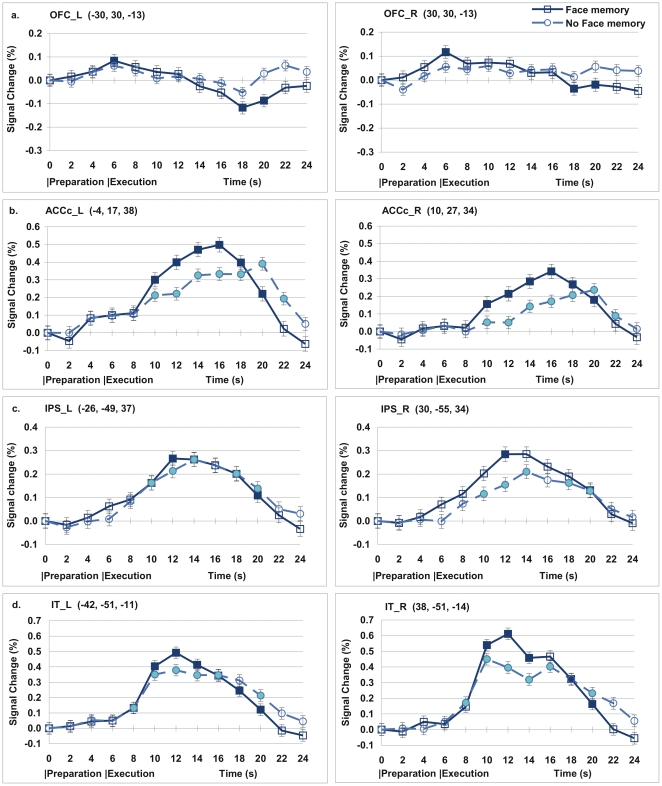
Figure 4. Signal change (%) across the time course.
(a) Orbitofrontal cortex (OFC) showed activation during preparation and deactivation during execution. (b) Left Caudal Anterior Cingulate Cortex (ACCc) exhibited activation during preparation and execution. (c) Intraparietal sulcus (IPS) showed activation during execution. (d) Inferior Temporal cortex (IT) showed activation during execution. Inside the parentheses after each region name are the coordinates of the centre of the ROI. Error bars denote s.e.m. The filled data points indicate the points that the 99% confidence interval did not include zero. The blank data points indicate those points that the 99% confidence interval included zero. The central coordinates for each ROI is shown inside the parentheses.

