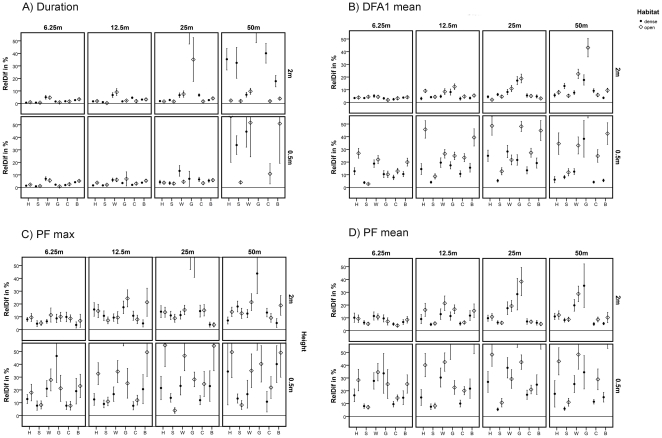
Figure 4. Validity of four different parameters in relation to habitat type, transmission height, distances and call type.
Four different acoustic parameters are shown in the graphs; (A) Duration, (B) DFA1 mean, (C) PF max, (D) PF mean. The x-axis shows the different call types, H: harsh bark, S: scream, W: wahoo, G: Grunt, C: clear call and B: clear bark. The y-axis shows the relative differences of the acoustic parameters for each condition. Panel rows represent different heights, while panel columns represent different distances. The plots indicate mean values across five different localities; error bars indicate the confidence interval of 95 %. The horizontal lines denote a variation of 0 %.

