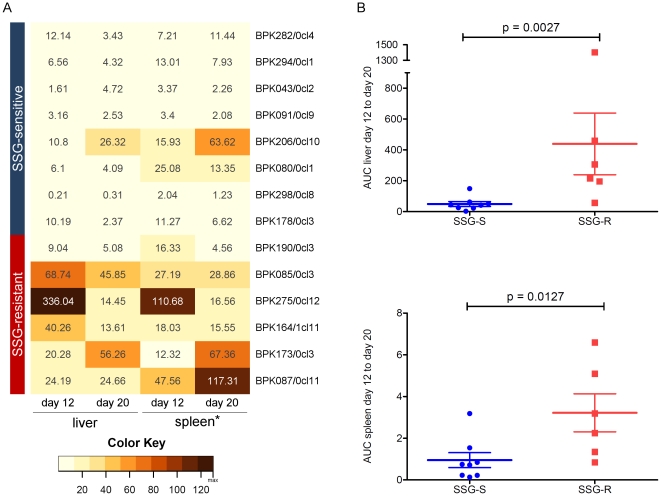
Figure 1. In vivo parasite load in liver and spleen of BALB/c mice caused by SSG-R and SSG-S strains.
(A) Heat map showing mean parasite load in the liver and spleen* of infected mice at day 12 and day 20 post infection. *: spleen values were 100-times multiplied to allow easy comparison with liver in the heat map. (B) Total in vivo parasite load in infected mice calculated from the area under the day 12 to day 20 infection curve (AUC). P-values were calculated using the Mann Whitney U test. Horizontal bars indicate the mean and error bars indicate the standard error of the mean. The SSG-S strains show a homogenous infection profile in both the liver and spleen of infected BALB/c mice. Even though some variation is observed in the SSG-R group, analyses on both datasets indicate that SSG-R parasites cause a significant higher parasite burden in BALB/c mice compared to SSG-S parasites.

