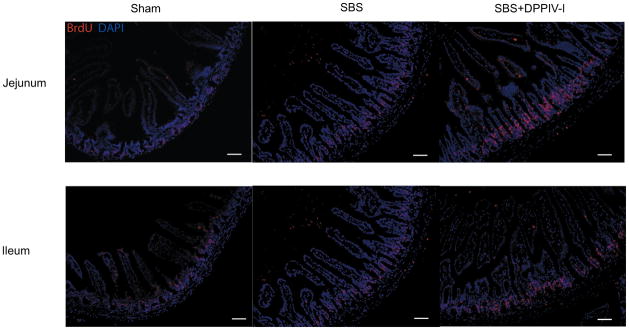
Figure 2.
Representative immunofluorescent images of jejunum and ileum are shown (left panels) after undergoing BrdU/DAPI staining (20X magnification) 3 days after a 50% small bowel resection. Indices of crypt cell proliferation rates are shown in the graphs (right panels). Note that the proliferation index was significantly increased in SBS+DPPIV-I mice. Results are shown as the mean ± SEM. Statistical comparisons are made using ANOVA with post hoc Bonferroni test. N=5–6. Scale bars:50μm

