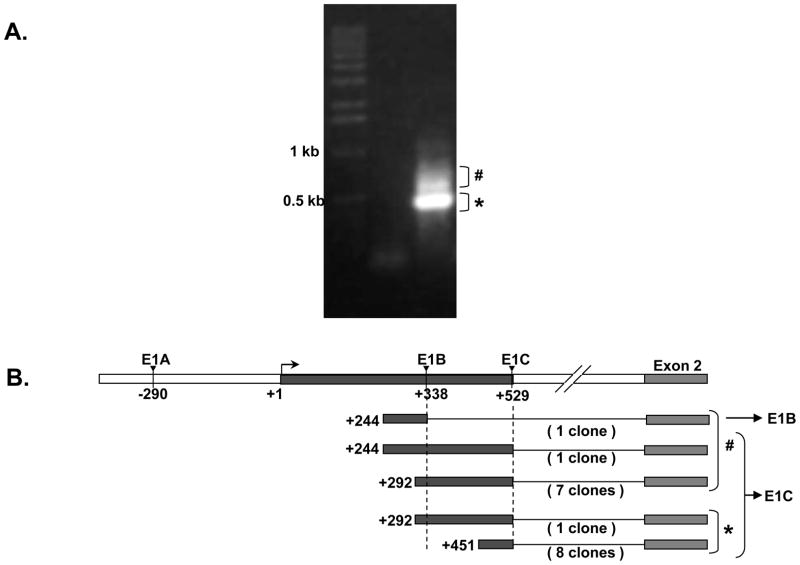
Figure 9. Human intestinal 5′ UTR analysis by RACE-PCR.
A) * denotes the 500 bp band observed on agarose gel electrophoresis of the nested RACE PCR product from human small intestinal RNA while # indicates disperse higher bands observed B) Diagrammatic alignment of the human small intestinal BCRP 5′ RACE sequences with the human E1B and E1c 5′ UTRs and Exon 2 of Human BCRP gene. E1C 5′ UTR was the highest 5′ UTR identified by 5′ RACE in the human small intestine. # and * indicate the 5′ RACE clones obtained from the disperse higher bands and the prominent 500bp band respectively.

