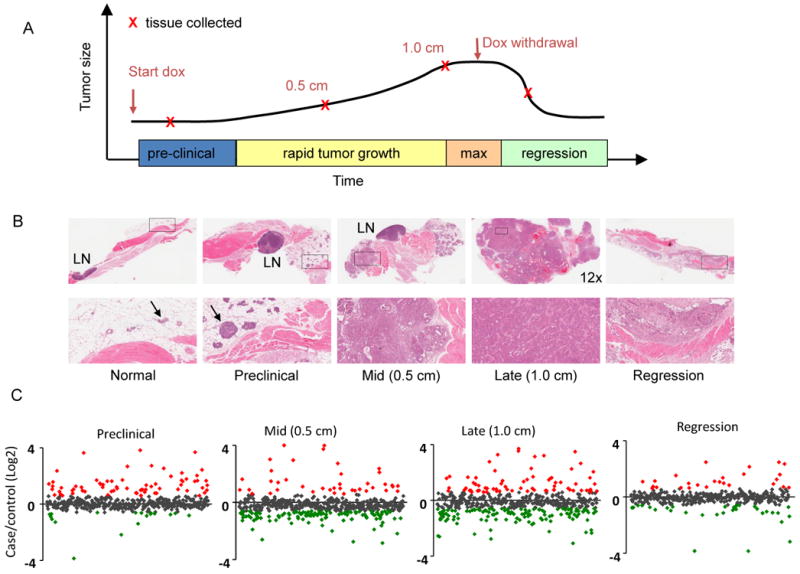
Figure 1. Histologic and plasma proteomic analysis of HER2/neu mammary tumor progression.

(A) Samples were collected from litter-matched case and control mice at indicated stages. (B) H&E staining of mammary tissue from bitransgenic case mice at the preclinical, 0.5 cm diameter, 1.0 cm diameter tumor stages and during tumor regression. Top row: 26× magnification unless otherwise indicated. Bottom row: 130× magnification of boxed sections from the top row. LN=lymph node. Arrows indicate breast epithelial cells within the mammary fat pads of normal and preclinical sections. (C) Case/control ratios of all quantified plasma proteins at all four tumor stages. Red indicates proteins increased >1.5 fold and green indicates proteins decreased >1.5 fold in plasma from case vs. control mice (p<0.05).
