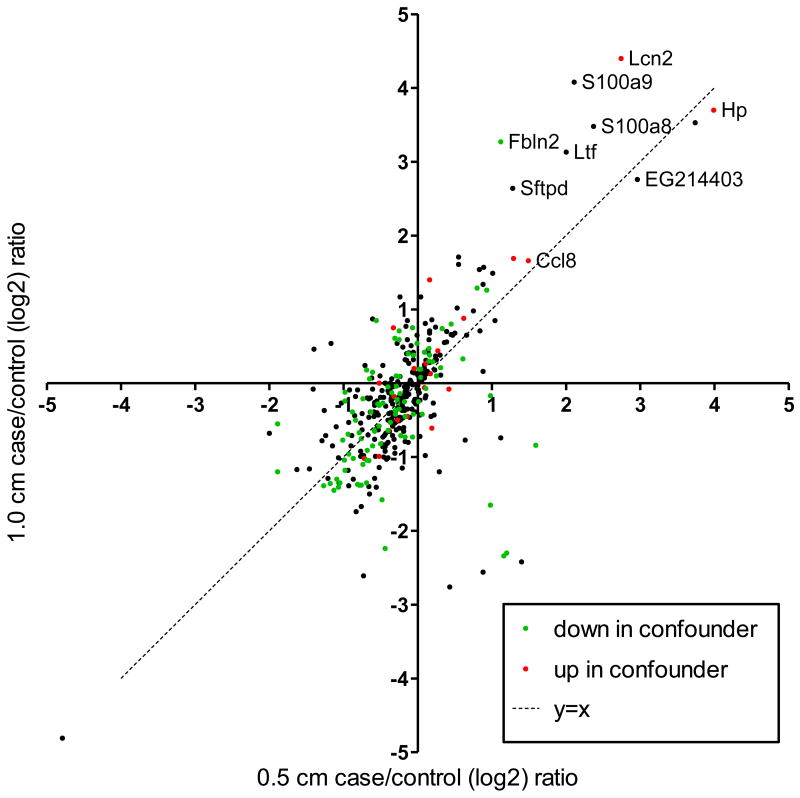
Figure 4. Correlation of plasma protein abundance between tumor stages.
Shown are case/control ratios for plasma proteins that were quantified in both 0.5 and 1.0 cm tumor stages. Green and red data points indicate proteins identified as increased or decreased in the plasma from the confounder models, respectively.

