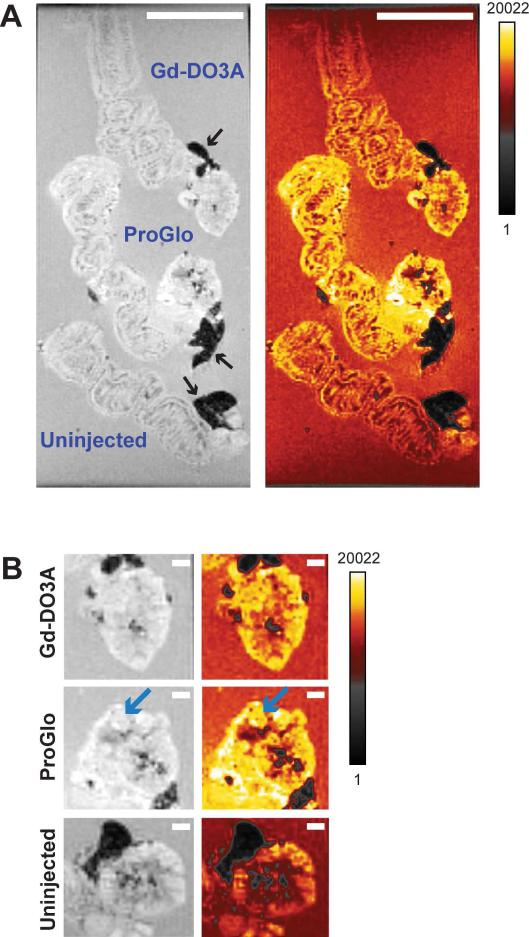
Figure 5.
Ex vivo images of the uterus and ovaries after injection of Gd-DO3A or ProGlo in superovulated female CD-1 mice. A, Ex vivo images of the uterus and ovaries harvested 2 hours after injection with Gd-DO3A (top), injection with ProGlo (middle), or no injection (bottom). Black arrows designate fat. Color images highlight areas of increased signal intensity (calibration bar represents signal intensity in arbitrary units). White scale bars represent 5 mm. B, Ex vivo images of the ovaries after injection with Gd-DO3A (top), injection with ProGlo (middle), or no injection (bottom). Blue arrows highlight ovarian follicles. White scale bars represent 1 mm.

