Figure 6.
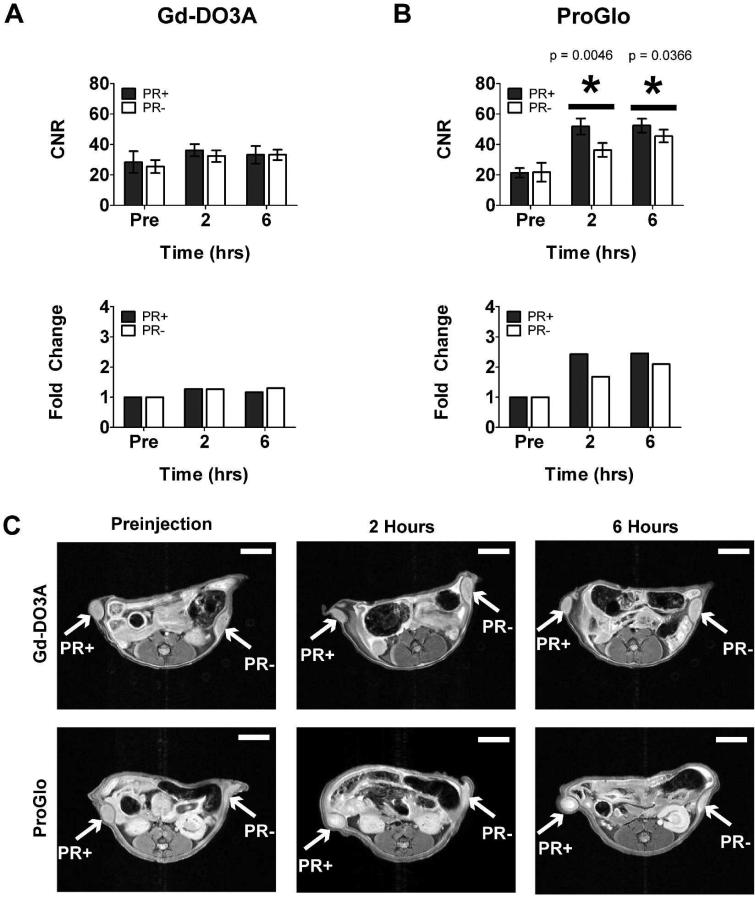
Contrast-to-noise ratios (CNRs) in tumor xenografts after intraperitoneal injection of Gd-DO3A or ProGlo in female nude mice. A, Average CNR of PR(+) or PR(-) tumors over time after intraperitoneal injection of Gd-DO3A (top) and change in average CNR compared to the average preinjection CNR (bottom). B, Average CNR of PR(+) or PR(-) tumors over time after intraperitoneal injection of ProGlo (top) and the fold change in CNR over the preinjection (pre) levels (bottom). Significant CNR enhancement was seen after intraperitoneal injection of ProGlo in the PR(+) tumor over the PR(-) tumor at 2 and 6 hours post-injection (asterisks, top graph, Student's t test, p < 0.05). Data are mean ± standard deviation. P-values (Student's t test, p < 0.05) are shown in the graph. C, Representative images of xenografted mice injected intraperitoneally with Gd-DO3A (top panels) or ProGlo (bottom panels). White scale bars represent 5 mm.

