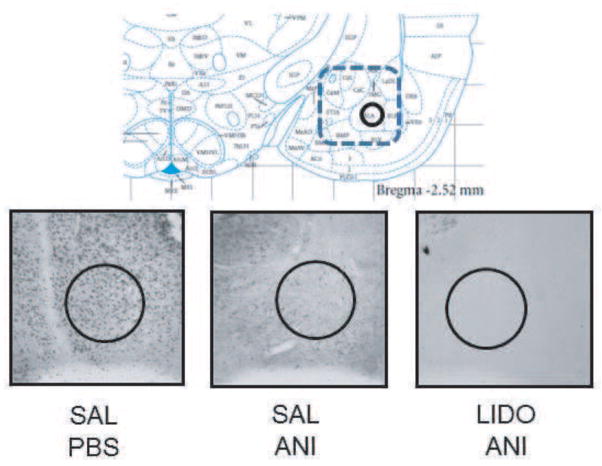
Figure 3.
Top: Schematic showing placement of electrodes and sampling area for c-Fos expression (adapted from Paxinos and Watson, 2005, Figure 54). The rectangular dashed line identifies the area in which cannulae placements were accepted for behavioral and immunohistochemistry analyses. The circle (top and bottom of this figure; 455 μm diameter) represents the area analyzed for immunohistochemistry. Bottom: Representative pictures of c-Fos immunohistochemistry. Note that anisomycin reduced c-Fos expression; lidocaine did not attenuate the inhibition of c-Fos immunoreactivity caused by anisomycin. SAL= saline; PBS=phosphate-buffered saline; ANI = anisomycin; LIDO = lidocaine.

